

Financial Information and Risk Management
I
Financial Information and Risk Management
Financial Information and Risk Management
Financial Position, Profitability and Solvency
With a solid financial structure that included TL 5,092 million in shareholders’ equity at end-2024, Aksigorta is one of the leading companies in the Turkish insurance sector.
Continuing to grow upon sustainable profitability, Aksigorta completed the year with TL 34,872 million of premium production.
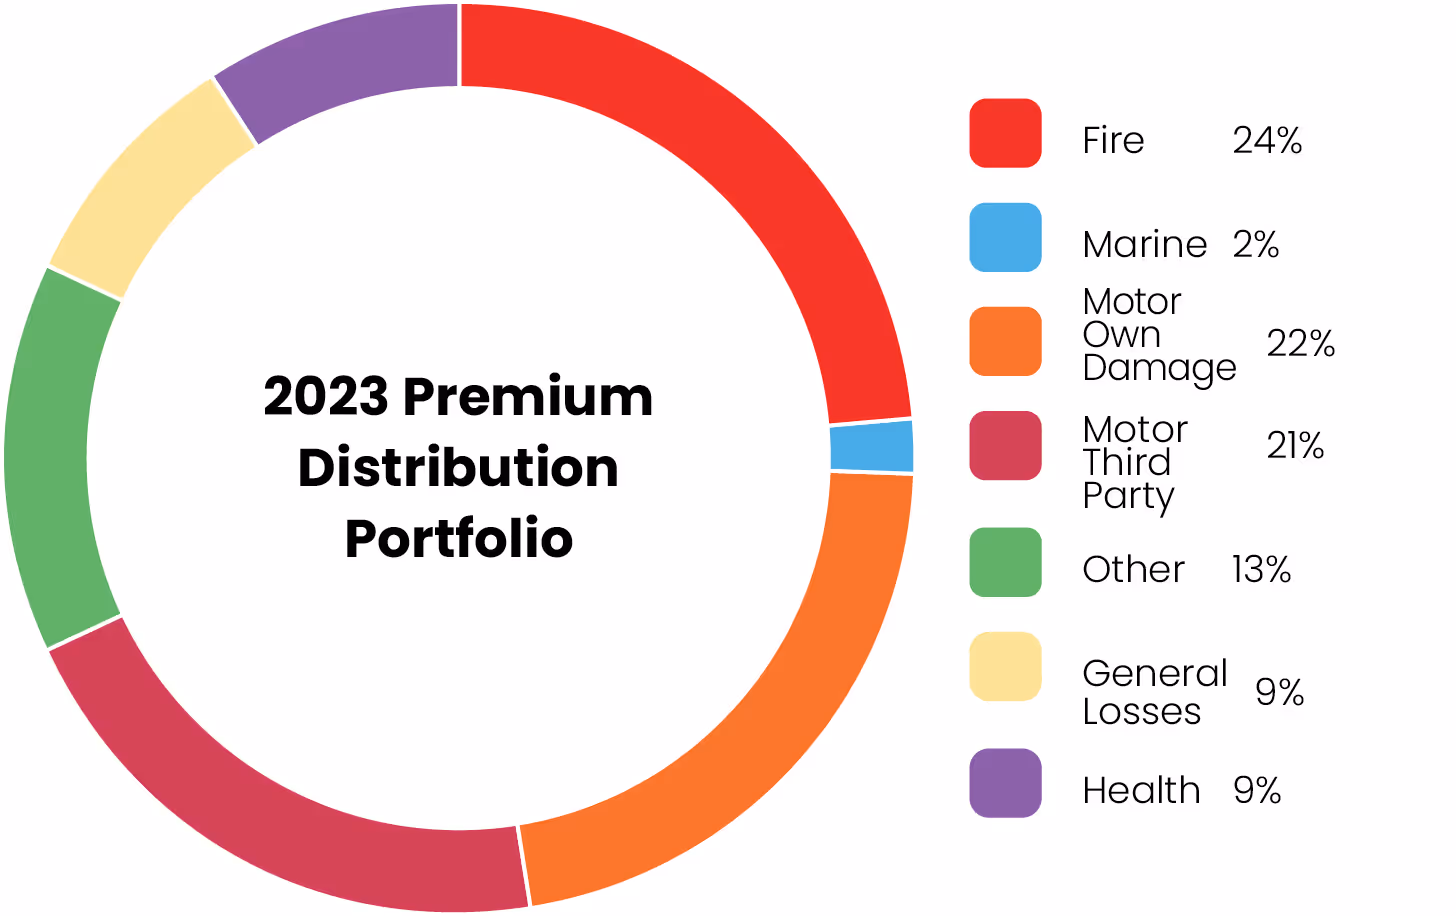
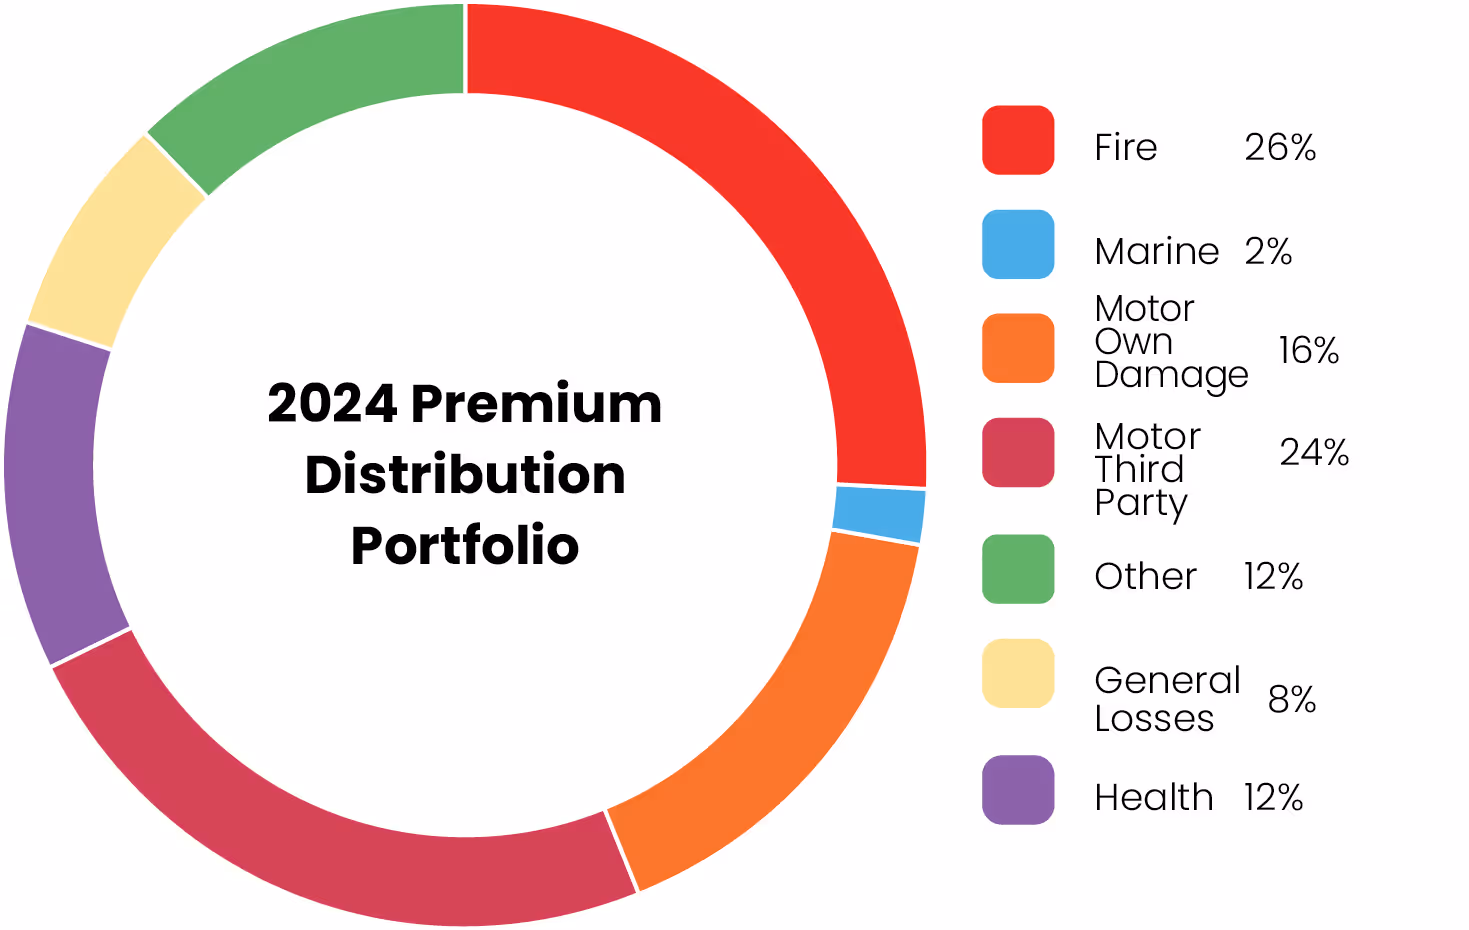
In 2024, the Company reached to TL 34,872 million premium production. A breakdown of premiums by business line during the most recent two years is shown below.
Net Investment Income
Tablonun devamı için sağa kaydırın
| (TL Thousand) | 2023 | 2024 | Change 23/24% | 2023 | 2024 |
| Fire | 6.619.369 | 9,086,714 | 37% | 24% | 26% |
| Marine | 415,301 | 552,897 | 33% | 2% | 2% |
| Motor Own Damage | 5,914,420 | 5,506,965 | -7% | 22% | 16% |
| Motor Third Party | 5,690,989 | 8,429,481 | 48% | 21% | 24% |
| Other | 3,717,830 | 4,152,264 | 12% | 14% | 12% |
| General Losses | 2,381,553 | 2.796.812 | 17% | 9% | 8% |
| Health | 2,559,286 | 4,346,677 | 70% | 9% | 12% |
| Total | 27,298,748 | 34,871,810 | 28% | 100% | 100% |
As of end-2024, 32% of generated premiums amounting to TL 11,057 million in value were retained by the Company. The charts below show the amounts and relative percentages of produced premiums that were retained by the Company during the most recent two years, broken down by business line.
Tablonun devamı için sağa kaydırın
| Retention Premium (TL Thousand) | Retention Premium (TL Thousand) | Retention Ratio (%) | Retention Ratio (%) | |
| 2023 | 2024 | 2023 | 2024 | |
| Fire | 1,037,279 | 1,291,404 | 16% | 14% |
| Marine | 93,577 | 94,582 | 23% | 17% |
| Motor Own Damage | 4,681,342 | 4,186,363 | 79% | 76% |
| Motor Third Party | 2,840,098 | 3,483,672 | 50% | 41% |
| Other | 529,813 | 775,307 | 14% | 19% |
| General Losses | 438,890 | 770,317 | 18% | 28% |
| Health | 281,123 | 455,379 | 11% | 10% |
| Total | 9,902,123 | 11,057,024 | 36% | 32% |
As of end-2024, Aksigorta retained TL 10,276,963 in premiums which it had earned in the non-life branch. Meanwhile, the Company’s share of incurred non-life claims amounted to TL 8,888,942. As of the same date, the ratio of incurred non-life claims to earned premiums (net) was 86%. The charts below show the amounts and relative percentages of the Company’s incurred claims and earned premiums during the most recent two years, broken down by business line:
Tablonun devamı için sağa kaydırın
| Claims Incurred (Net) | Claims Incurred (Net) | Earned Premiums (Net) | Earned Premiums (Net) | Claims Incurred / Earned Premiums (Net) (%) | Claims Incurred / Earned Premiums (Net) (%) | |
| (TL Thousand) | 2023 | 2024 | 2023 | 2024 | 2023 | 2024 |
| Fire | 390,744 | 534,567 | 617,406 | 880,024 | 63% | 61% |
| Marine | 60,021 | 63,613 | 114,170 | 140,901 | 53% | 45% |
| Motor Own Damage | 2,412,977 | 3,077,241 | 3,988,888 | 5,006,814 | 60% | 61% |
| Motor Third Party | 3,563,604 | 4,836,234 | 2,114,068 | 2,657,444 | 169% | 182% |
| Other | 140,202 | 268,843 | 554,432 | 1,056,235 | 25% | 25% |
| General Losses | 49,552 | 98,360 | 84,353 | 173,114 | 59% | 57% |
| Health | 4,735 | 10,083 | 203,396 | 362,431 | 2% | 3% |
| Total | 6,621,835 | 8,888,942 | 7,676,713 | 10,276,963 | 86% | 86% |
Technical Profit Balance
At end-2024, Aksigorta showed a total technical profit amounting to TL 2,105 million. The charts below show the amounts and relative percentages of the Company’s technical profit during the most recent two years, broken down by business line.
General Technical Profit Balance
Tablonun devamı için sağa kaydırın
| (TL Thousand) | 2023 | 2024 |
| Fire | 757,513 | 791,937 |
| Marine | 106,469 | 139,667 |
| Motor Own Damage | 1,208,137 | 1,202,714 |
| Motor Third Party | -1,509,259 | -1,865,523 |
| Other | 560,003 | 974,538 |
| General Losses | 189,014 | 285,639 |
| Health | 378,667 | 576,396 |
| Total | 1,690,544 | 2,105,368 |
General Technical Profit Balance/Written Premiums (%) (Non-life)
Tablonun devamı için sağa kaydırın
| (TL Thousand) | 2023 | 2024 |
| Fire | 11 | 9 |
| Marine | 26 | 25 |
| Motor Own Damage | 20 | 22 |
| Motor Third Party | -27 | -22 |
| Other | 15 | 23 |
| General Losses | 8 | 10 |
| Health | 15 | 13 |
| Total | 6 | 6 |
In 2024, Aksigorta earned TL 4,532 million in net investment income in addition to the earnings generated by its insurance business activities. The Company’s investment income during the most recent two years is shown below.
Tablonun devamı için sağa kaydırın
| Net Investment Income (TL Thousand) | 2023 | 2024 | Change 23/24 % |
| Foreign Exchange Gain | 908,721 | 417,652 | -54% |
| Income from Financial Investment | 1,970,328 | 4,114,679 | 109% |
| Income from Derivatives | -8,864 | 0 | -100% |
| Total Net Investment Income | 2,870,185 | 4,532,331 | 58% |
Based on all of these technical and financial results, Aksigorta booked profit before tax of TL 1,857 million. The Company’s shareholders’ equity amounted to TL 5,092 million at end-2024. The breakdown of shareholders’ equity items during the most recent two years is shown below:
Tablonun devamı için sağa kaydırın
| Shareholders’ Equity (TL Million) | 2023 | 2024 | Change 23/24 % |
| Paid-in Capital | 1,612 | 1,162 | 0% |
| Profit and Capital Reserves | 436 | 395 | -9% |
| Previous Years Income/Loss | 43 | 1,228 | - |
| Net Profit/Loss for the Period | 1,185 | 1,857 | 57% |
| Total Shareholders’ Equity | 3,276 | 5,092 | 55% |
At end-2024, Aksigorta’s principal investments amounted to TL 8,703 million in value.
Developments in the Company’s investments during the most recent two years are shown below:
Tablonun devamı için sağa kaydırın
| Investments (TL Thousand) | 2023 | 2024 | Change 23/24 % |
| Financial Assets and Investments with Risks on Policyholders | 6,248,738 | 8,702,613 | 39% |
| Subsidiaries | 100,000 | 0 | -100% |
| Properties | 5 | 5 | %0 |
| Total Investments | 6,348,743 | 8,702,619 | 86% |
Aksigorta does not have affiliates as of the end of 2024.

